
Percival Not As Bad In '08 As You Might Think
Yesterday we linked to a story by Joe Posnanski in which he rated managers on their decisions to intentionally walk batters and how often it comes back to bite the manager in the butt (If you missed it, the short version is Posnanski finally found something Papa Joe sucks at).
Within that piece, Posnanski generates a new statistic to evaluate closers based on a classification system generated in the upcoming "Bill James Handbook". In the handbook, James breaks down save opportunities into three categories:
Posnanski looked at how the best and worst closers fared in 2008 (he does not provide the complete list). Mariano Rivera topped the list with a CLOSER+ of 145 (100 is average for relief pitchers, while the average closer is about 115*). Part of the reason for Rivera's exceptional rating is because he was five-for-five in "Tough" saves.
Posnanski gives us the top 10 closers and the worst closer (JJ Putz). Troy Percival's rating was not provided. So we applied the save conversion rates to see how many saves an average relief pitcher and an average closer would have been expected to convert had they been given all of Percival's save opportunities. Then we calculated Percy's CLOSER+ to see how he compared to other relief pitchers and other closers.
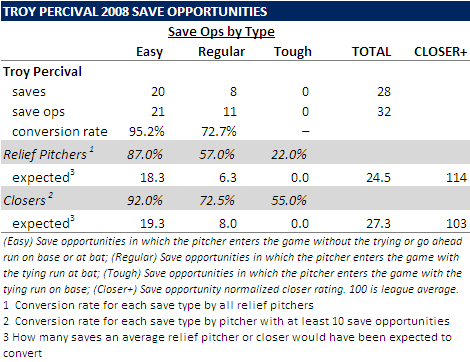 Percival converted 28 of 32 saves on the season. 21 of those save chances fell into the "Easy" category, while the other 11 were deemed "regular". Percival did not face any "Tough" save opportunities this season.
Based on the league average conversion rates, a typical relief pitcher would have converted 24.5 saves, while an average closer would have converted 27.3 saves. Percival's 28 saves translates to a 114 CLOSER+ when compared to relief pitchers and a 103 CLOSER+ when only compared to closers with at least 10 save opportunities. In other words, Percy was 14% better than a typical relief pitcher when it comes to save opportunities, and 3% better than the average closer.
This is not without problems. This only includes games in which Percival either converted or blew a save. There were a couple of outings in which Percival was brought in for a save and left after being knocked around a bit but did not blow the lead. Those games are not considered here. This rating also does not take into account Percival's three trips to the DL and the negative impact those trips left on the bullpen and pitching staff.
Still, for all intents and purposes, Percival was at worst, an average closer in 2008.
For fun, we decided to also look at Dan Wheeler and Grant Balfour. Take Balfour's numbers with a grain of salt as his numbers represent a very small sample size.
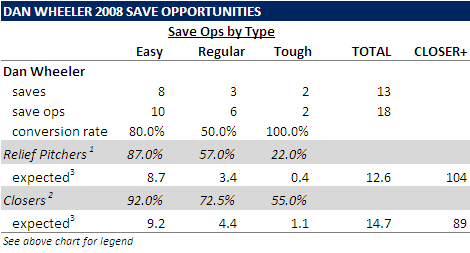 No surprise here. Wheeler was downright awful as a closer blowing 2 "Easy" saves and 3 "Regular" saves. Wheeler was 11% worse than an average closer (CLOSER+ 89) even though he converted both of his tough save situations. Wheeler's most memorable "Tough" save was when he was called on with 2 outs in the 9th after Joe Maddon intentionally walked Josh Hamilton with the bases loaded, putting the tying run on first base. Wheeler struck out Marlon Byrd to end the game.
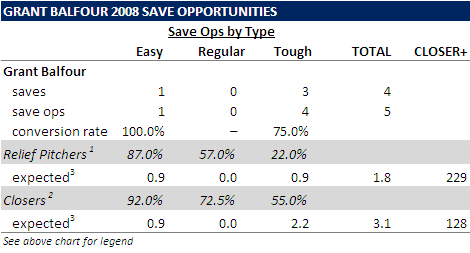 Balfour on the other hand had very strong CLOSER+ ratings. This is attributable to his 3 for 4 showing in "Tough" save situations. But again, this is a very small sample size. Still, we are curious to see the entire list as Balfour's 3 "Tough" saves and 75% conversion rate in those situations are probably near the top of both lists. As Posnanski points out, "Tough" saves are very rare. Most managers prefer to start the 9th inning with their closer and rarely let their closers work more than an inning. Therefore, it is very rare for a closer to enter a game with runners on base.
While determining the closer for 2009 seems to be a priority for the Rays, it should be noted that Percival is still a viable option if he does not retire and stays healthy. Of course, staying healthy might be a little easier if he lays off the jelly doughnuts.
*To clarify. The conversion rates for closers, are from the "Bill James Handbook" and represent pitchers with at least 10 save opportunities. However, when Posnanski ranks the closers, he only uses pitchers with at least 20 save opportunities. The average CLOSER+ rating for Posnanski's list is about 115. That number is a little lower if pitchers with at least 10 save opportunities are considered. That is why Percival has a 114 when compared to all relief pitchers but is actually above average (103) when compared to closers. Percival is being compared to closers with at least 10 save opportunities.
Within that piece, Posnanski generates a new statistic to evaluate closers based on a classification system generated in the upcoming "Bill James Handbook". In the handbook, James breaks down save opportunities into three categories:
1. Easy Save. This is a save when the first batter faced is not the tying or go-ahead run.Based on how often relief pitchers and closers (min. 10 save opportunities) convert each of the three save types, Posnanski developed a back-of-the-napkin statisitic (CLOSER+) as a way to compare relief pitchers, while weighing the types of saves each pitcher faces. For example, if 2 pitchers each have 20 save chances but one pitcher faces 20 "Tough" saves chances, while the other pitcher only faces 20 "Easy" chances, the first pitcher would be expected to have less total saves at the end of the season.
2. Tough save: This is a save when the tying or go ahead run is already on base when you take over.
3. Regular save: Everything else. [Typically, a "regular" save is when a pitcher starts the 9th inning with a 1-run lead.]
Posnanski looked at how the best and worst closers fared in 2008 (he does not provide the complete list). Mariano Rivera topped the list with a CLOSER+ of 145 (100 is average for relief pitchers, while the average closer is about 115*). Part of the reason for Rivera's exceptional rating is because he was five-for-five in "Tough" saves.
Posnanski gives us the top 10 closers and the worst closer (JJ Putz). Troy Percival's rating was not provided. So we applied the save conversion rates to see how many saves an average relief pitcher and an average closer would have been expected to convert had they been given all of Percival's save opportunities. Then we calculated Percy's CLOSER+ to see how he compared to other relief pitchers and other closers.
Percival converted 28 of 32 saves on the season. 21 of those save chances fell into the "Easy" category, while the other 11 were deemed "regular". Percival did not face any "Tough" save opportunities this season.Based on the league average conversion rates, a typical relief pitcher would have converted 24.5 saves, while an average closer would have converted 27.3 saves. Percival's 28 saves translates to a 114 CLOSER+ when compared to relief pitchers and a 103 CLOSER+ when only compared to closers with at least 10 save opportunities. In other words, Percy was 14% better than a typical relief pitcher when it comes to save opportunities, and 3% better than the average closer.
This is not without problems. This only includes games in which Percival either converted or blew a save. There were a couple of outings in which Percival was brought in for a save and left after being knocked around a bit but did not blow the lead. Those games are not considered here. This rating also does not take into account Percival's three trips to the DL and the negative impact those trips left on the bullpen and pitching staff.
Still, for all intents and purposes, Percival was at worst, an average closer in 2008.
For fun, we decided to also look at Dan Wheeler and Grant Balfour. Take Balfour's numbers with a grain of salt as his numbers represent a very small sample size.
No surprise here. Wheeler was downright awful as a closer blowing 2 "Easy" saves and 3 "Regular" saves. Wheeler was 11% worse than an average closer (CLOSER+ 89) even though he converted both of his tough save situations. Wheeler's most memorable "Tough" save was when he was called on with 2 outs in the 9th after Joe Maddon intentionally walked Josh Hamilton with the bases loaded, putting the tying run on first base. Wheeler struck out Marlon Byrd to end the game.Balfour on the other hand had very strong CLOSER+ ratings. This is attributable to his 3 for 4 showing in "Tough" save situations. But again, this is a very small sample size. Still, we are curious to see the entire list as Balfour's 3 "Tough" saves and 75% conversion rate in those situations are probably near the top of both lists. As Posnanski points out, "Tough" saves are very rare. Most managers prefer to start the 9th inning with their closer and rarely let their closers work more than an inning. Therefore, it is very rare for a closer to enter a game with runners on base.While determining the closer for 2009 seems to be a priority for the Rays, it should be noted that Percival is still a viable option if he does not retire and stays healthy. Of course, staying healthy might be a little easier if he lays off the jelly doughnuts.
*To clarify. The conversion rates for closers, are from the "Bill James Handbook" and represent pitchers with at least 10 save opportunities. However, when Posnanski ranks the closers, he only uses pitchers with at least 20 save opportunities. The average CLOSER+ rating for Posnanski's list is about 115. That number is a little lower if pitchers with at least 10 save opportunities are considered. That is why Percival has a 114 when compared to all relief pitchers but is actually above average (103) when compared to closers. Percival is being compared to closers with at least 10 save opportunities.
Labels: Dan Wheeler, Grant Balfour, Mo Rivera, Troy Percival
posted by The Professor at 12:30 PM
![]()
![]()


2 Comments:
moral of the story? teach grant strike3 a changeup or a nasty slider and make him closer
would that be fair to the batters?
Post a Comment
<< Home